投稿者のアーカイブ
Yeomanを使ってみる
Yeomanがどういうものなのか詳しくは公式サイトを見ていただくとして、
要はWEBアプリを作る際の基本的な環境構築をパパっとやっちゃいますよ?というものです
気になっていたので、触ってみることにします
環境設定
Node.jsとnpmを入れていることが前提
Yeomanをインストール
$ sudo npm install --global yo bower grunt-cli
確認
$ yo --version && bower --version && grunt --version
Yeomanジェネレータをインストール
AngularJSGeneratorをインストール
$ sudo npm install --global generator-angular
プロジェクトフォルダ作成
$ mkdir yeoman
$ cd yeoman
実行すると今までインストールしたジェネレータのリストが出てくるので、必要な物をインストール
$ yo
? 'Allo XXXX! What would you like to do?
  Run a generator
  Angular
  Karma
  ──────────────
  Update your generators
  Install a generator
❯ Find some help
  Get me out of here!
  ──────────────
今回はAngular generatorを使いたいので、Angularを選択する。
$ yo
? 'Allo XXXX! What would you like to do? Angular

Make sure you are in the directory you want to scaffold into.
This generator can also be run with: yo angular


     _-----_
    |       |    .--------------------------.
    |--(o)--|    |    Welcome to Yeoman,    |
   `---------´   |   ladies and gentlemen!  |
    ( _´U`_ )    '--------------------------'
    /___A___\
     |  ~  |
   __'.___.'__
 ´   `  |° ´ Y `

Out of the box I include Bootstrap and some AngularJS recommended modules.

? Would you like to use Sass (with Compass)? (Y/n)
Saas使う?Bootstrap使う?モジュール使う?等聞かれるので、適時好きなように。今回はこのように選択しました。
? Would you like to use Sass (with Compass)? No
? Would you like to include Bootstrap? Yes
? Which modules would you like to include?
 ◉ angular-animate.js
❯◯ angular-aria.js
 ◉ angular-cookies.js
 ◉ angular-resource.js
 ◯ angular-messages.js
 ◉ angular-route.js
 ◉ angular-sanitize.js
 ◉ angular-touch.js
そしていつもどおりうまく行かない… 権限?
〜〜〜
npm WARN excluding symbolic link build/defs-config.json -> ../defs-config.json
npm ERR! Error: EACCES, mkdir '/Users/XXXX/.npm/debug/2.1.0'
npm ERR!  { [Error: EACCES, mkdir '/Users/XXXX/.npm/debug/2.1.0']
npm ERR!   errno: 3,
npm ERR!   code: 'EACCES',
npm ERR!   path: '/Users/XXXX/.npm/debug/2.1.0',
npm ERR!   parent: 'grunt-usemin' }
npm ERR!
npm ERR! Please try running this command again as root/Administrator.
色々トライしてみた結果キャッシュなくせばいいということだったらしい
$ npm cache clean
いけた!と思ったらこれ。npmが古いらしい。
〜〜〜
npm ERR! Error: ENOENT, open '/Users/XXXXX/Program/workspace/yeoman/node_modules/grunt/package.json'
npm ERR! If you need help, you may report this *entire* log,
npm ERR! including the npm and node versions, at:
npm ERR!

npm ERR! System Darwin 13.4.0
npm ERR! command "/usr/local/bin/node" "/usr/local/bin/npm" "install"
npm ERR! cwd /Users/XXXXX/Program/workspace/yeoman
npm ERR! node -v v0.10.33
npm ERR! npm -v 1.4.28
npm ERR! path /Users/XXXXX/Program/workspace/yeoman/node_modules/grunt/package.json
npm ERR! code ENOENT
npm ERR! errno 34
npm ERR! not ok code 0
npmをもう一度入れなおして実行したらいけました
〜〜〜
└── js-yaml@2.0.5 (esprima@1.0.4, argparse@0.1.15)
app/index.html modified.


     _-----_
    |       |    .---------------------------------------.
    |--(o)--|    |        Bye from us! Chat soon.        |
   `---------´   |                                       |
    ( _´U`_ )    |            The Yeoman Team            |
    /___A___\    | https://github.com/yeoman/yeoman#team |
     |  ~  |     '---------------------------------------'
   __'.___.'__
 ´   `  |° ´ Y `
コレがファイル一覧
$ ls -al
total 88
drwxr-xr-x  15 XXXX  staff   510 11 14 10:00 .
drwxr-xr-x  36 XXXX  staff  1224 11 13 17:48 ..
-rw-r--r--   1 XXXX  staff    38 11 14 09:55 .bowerrc
-rw-r--r--   1 XXXX  staff   415  7  1 07:39 .editorconfig
-rw-r--r--   1 XXXX  staff    11  7  1 07:39 .gitattributes
-rw-r--r--   1 XXXX  staff    52  7  1 07:39 .gitignore
-rw-r--r--   1 XXXX  staff   394  7  1 07:39 .jshintrc
-rw-r--r--   1 XXXX  staff   110  5 15  2014 .travis.yml
-rw-r--r--   1 XXXX  staff  9815 11 14 09:55 Gruntfile.js
drwxr-xr-x  12 XXXX  staff   408 11 14 09:55 app
-rw-r--r--   1 XXXX  staff   414 11 14 09:55 bower.json
drwxr-xr-x  13 XXXX  staff   442 11 14 09:57 bower_components
drwxr-xr-x  29 XXXX  staff   986 11 14 10:00 node_modules
-rw-r--r--   1 XXXX  staff  1066 11 14 10:00 package.json
drwxr-xr-x   5 XXXX  staff   170 11 14 09:55 test
で、gruntを実行
$ grunt serve
Running "serve" task

Running "clean:server" (clean) task

Running "wiredep:app" (wiredep) task
Warning: ENOENT, no such file or directory '/Users/XXXX/yeoman/app/bower.json' Use --force to continue.

Aborted due to warnings.


Execution Time (2014-11-14 01:06:06 UTC)
loading tasks    6ms  ▇▇▇ 1%
wiredep:app    528ms  ▇▇▇▇▇▇▇▇▇▇▇▇▇▇▇▇▇▇▇▇▇▇▇▇▇▇▇▇▇▇▇▇▇▇▇▇▇▇▇▇▇▇▇▇▇▇▇▇▇▇▇▇▇▇▇▇▇▇▇▇▇▇▇▇▇▇▇▇▇▇▇▇▇▇▇▇▇▇▇▇▇▇▇▇▇▇▇▇▇▇▇▇▇▇▇▇▇▇▇▇▇▇▇▇▇▇▇▇▇▇▇▇▇▇▇▇▇▇▇▇▇▇▇▇▇▇▇▇▇▇▇▇▇▇▇▇▇▇▇▇▇▇▇▇▇▇▇▇▇▇▇▇▇▇▇▇▇▇▇▇▇▇▇▇▇▇▇▇▇▇▇▇▇▇▇▇▇▇▇▇▇▇▇▇▇▇▇▇▇▇▇▇▇▇▇▇▇▇▇▇▇ 98%
Total 540ms
うーん・・・なんかbower.jsonのパスが違う
調べてみたところGruntfile.jsに少し編集をいれるといいらしい。
wiredepセクションのcwdを空にしました。
163     // Automatically inject Bower components into the app
164     wiredep: {
165       options: {
166 //        cwd: '<%= yeoman.app %>'
167         cwd: ''
168       },
で、もう一回トライ
$ grunt serve
Running "serve" task

Running "clean:server" (clean) task

Running "wiredep:app" (wiredep) task
app/index.html modified.

Running "concurrent:server" (concurrent) task

    Running "copy:styles" (copy) task
    Copied 1 files

    Done, without errors.


    Execution Time (2014-11-14 01:16:24 UTC)
    loading tasks  3ms  ▇▇▇▇▇▇▇▇▇▇▇▇▇ 27%
    copy:styles    7ms  ▇▇▇▇▇▇▇▇▇▇▇▇▇▇▇▇▇▇▇▇▇▇▇▇▇▇▇▇▇▇ 64%
    Total 11ms

Running "autoprefixer:dist" (autoprefixer) task
File .tmp/styles/main.css created.

Running "connect:livereload" (connect) task
Started connect web server on http://localhost:9000

Running "watch" task
Waiting...
いけた!!!
自動でブラウザが開かれます
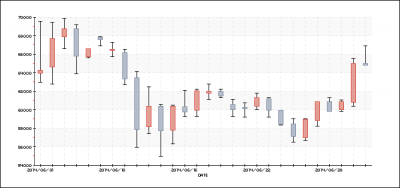
pChart2でグラフを描く
ロウソクチャートが使えるライブラリを探してみたところ、
pChart2というライブラリを見つけましたので紹介したいと思います
もともとあったpChartから更に扱えるグラフの種類が増えました
addPointsに配列で値を入力することで、グラフに値が描画されます
今回はDBから値を抜き出して配列にしているのですが、そこは省略しています
// グラフ生成
$dir = dirname(__FILE__) .'/../../public/pChart/';
include($dir .'class//pData.class.php');
include($dir .'class/pDraw.class.php');
include($dir .'class/pImage.class.php');
include($dir .'class/pStock.class.php');

/* Create and populate the pData object */
$MyData = new pData();
$MyData->addPoints($addOpen,"Open");
$MyData->addPoints($addClose,"Close");
$MyData->addPoints($addMin,"Min");
$MyData->addPoints($addMax,"Max");

$MyData->addPoints($addDate,"Time");
$MyData->setAbscissa("Time");
$MyData->setAbscissaName("Date");

/* Create the pChart object */
$myPicture = new pImage(700,330,$MyData);

/* Turn of AAliasing */
$myPicture->Antialias = FALSE;

/* Draw the border */
$myPicture->drawRectangle(0,0,699,329,array("R"=>0,"G"=>0,"B"=>0));

$myPicture->setFontProperties(array("FontName"=>$dir ."fonts/pf_arma_five.ttf","FontSize"=>6));

/* Define the chart area */
$myPicture->setGraphArea(60,30,650,290);

/* Draw the scale */
$scaleSettings = array("GridR"=>200,"GridG"=>200,"GridB"=>200,"DrawSubTicks"=>TRUE,"CycleBackground"=>TRUE);
$myPicture->drawScale($scaleSettings);

/* Create the pStock object */
$mystockChart = new pStock($myPicture,$MyData);

/* Draw the stock chart */
$stockSettings = array(
    "BoxUpR"=>226,"BoxUpG"=>159,"BoxUpB"=>149,
    "BoxDownR"=>180,"BoxDownG"=>188,"BoxDownB"=>201,
    'BoxUpBorderR'=>220,'BoxUpBorderG'=>75,'BoxUpBorderB'=>66,
    'BoxDownBorderR'=>127,'BoxDownBorderG'=>142,'BoxDownBorderB'=>166,
    );
$mystockChart->drawStockChart($stockSettings);

/* Render the picture (choose the best way) */
$myPicture->Stroke();
$dir = dirname(__FILE__) .'/../../public/pChart/';
include($dir .'class/pData.class.php');
include($dir .'class/pDraw.class.php');
include($dir .'class/pImage.class.php');

$MyData = new pData();
$MyData->addPoints($addPoint,"Stock price");
$MyData->addPoints($addDate,"Labels");
$MyData->setSerieDescription("Labels","Months");
$MyData->setAbscissa("Labels");


/* Create the pChart object */
$myPicture = new pImage(700,330,$MyData);

/* Turn of Antialiasing */
$myPicture->Antialias = FALSE;

/* Add a border to the picture */
$myPicture->drawRectangle(0,0,699,329,array("R"=>0,"G"=>0,"B"=>0));

/* Set the default font */
$myPicture->setFontProperties(array("FontName"=>$dir ."fonts/pf_arma_five.ttf","FontSize"=>6));

/* Define the chart area */
$myPicture->setGraphArea(60,40,650,300);

/* Draw the scale */
$scaleSettings = array("XMargin"=>10,"YMargin"=>10,"Floating"=>TRUE,"GridR"=>200,"GridG"=>200,"GridB"=>200,"DrawSubTicks"=>TRUE,"CycleBackground"=>TRUE);
$myPicture->drawScale($scaleSettings);

/* Turn on Antialiasing */
$myPicture->Antialias = TRUE;

/* Draw the line chart */
$myPicture->drawLineChart();

/* Write the chart legend */
$myPicture->drawLegend(540,20,array("Style"=>LEGEND_NOBORDER,"Mode"=>LEGEND_HORIZONTAL));
$myPicture->Stroke();
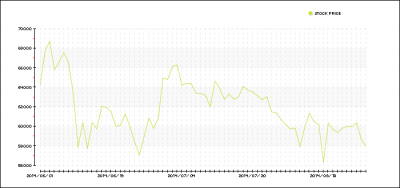
JpGraghとくらべても見栄えが良く、カスタマイズ性にも富んでいます
ただこのpChart2、更新がだいぶ前からされていないようなので、
その辺を注意して使わないといけないようです