pChart2でグラフを描く
ロウソクチャートが使えるライブラリを探してみたところ、
pChart2というライブラリを見つけましたので紹介したいと思います
もともとあったpChartから更に扱えるグラフの種類が増えました
addPointsに配列で値を入力することで、グラフに値が描画されます
今回はDBから値を抜き出して配列にしているのですが、そこは省略しています
// グラフ生成
$dir = dirname(__FILE__) .'/../../public/pChart/';
include($dir .'class//pData.class.php');
include($dir .'class/pDraw.class.php');
include($dir .'class/pImage.class.php');
include($dir .'class/pStock.class.php');
/* Create and populate the pData object */
$MyData = new pData();
$MyData->addPoints($addOpen,"Open");
$MyData->addPoints($addClose,"Close");
$MyData->addPoints($addMin,"Min");
$MyData->addPoints($addMax,"Max");
$MyData->addPoints($addDate,"Time");
$MyData->setAbscissa("Time");
$MyData->setAbscissaName("Date");
/* Create the pChart object */
$myPicture = new pImage(700,330,$MyData);
/* Turn of AAliasing */
$myPicture->Antialias = FALSE;
/* Draw the border */
$myPicture->drawRectangle(0,0,699,329,array("R"=>0,"G"=>0,"B"=>0));
$myPicture->setFontProperties(array("FontName"=>$dir ."fonts/pf_arma_five.ttf","FontSize"=>6));
/* Define the chart area */
$myPicture->setGraphArea(60,30,650,290);
/* Draw the scale */
$scaleSettings = array("GridR"=>200,"GridG"=>200,"GridB"=>200,"DrawSubTicks"=>TRUE,"CycleBackground"=>TRUE);
$myPicture->drawScale($scaleSettings);
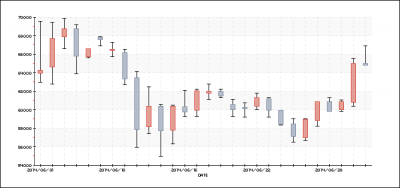
/* Create the pStock object */
$mystockChart = new pStock($myPicture,$MyData);
/* Draw the stock chart */
$stockSettings = array(
"BoxUpR"=>226,"BoxUpG"=>159,"BoxUpB"=>149,
"BoxDownR"=>180,"BoxDownG"=>188,"BoxDownB"=>201,
'BoxUpBorderR'=>220,'BoxUpBorderG'=>75,'BoxUpBorderB'=>66,
'BoxDownBorderR'=>127,'BoxDownBorderG'=>142,'BoxDownBorderB'=>166,
);
$mystockChart->drawStockChart($stockSettings);
/* Render the picture (choose the best way) */
$myPicture->Stroke();
$dir = dirname(__FILE__) .'/../../public/pChart/';
include($dir .'class/pData.class.php');
include($dir .'class/pDraw.class.php');
include($dir .'class/pImage.class.php');
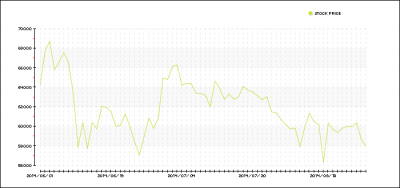
$MyData = new pData();
$MyData->addPoints($addPoint,"Stock price");
$MyData->addPoints($addDate,"Labels");
$MyData->setSerieDescription("Labels","Months");
$MyData->setAbscissa("Labels");
/* Create the pChart object */
$myPicture = new pImage(700,330,$MyData);
/* Turn of Antialiasing */
$myPicture->Antialias = FALSE;
/* Add a border to the picture */
$myPicture->drawRectangle(0,0,699,329,array("R"=>0,"G"=>0,"B"=>0));
/* Set the default font */
$myPicture->setFontProperties(array("FontName"=>$dir ."fonts/pf_arma_five.ttf","FontSize"=>6));
/* Define the chart area */
$myPicture->setGraphArea(60,40,650,300);
/* Draw the scale */
$scaleSettings = array("XMargin"=>10,"YMargin"=>10,"Floating"=>TRUE,"GridR"=>200,"GridG"=>200,"GridB"=>200,"DrawSubTicks"=>TRUE,"CycleBackground"=>TRUE);
$myPicture->drawScale($scaleSettings);
/* Turn on Antialiasing */
$myPicture->Antialias = TRUE;
/* Draw the line chart */
$myPicture->drawLineChart();
/* Write the chart legend */
$myPicture->drawLegend(540,20,array("Style"=>LEGEND_NOBORDER,"Mode"=>LEGEND_HORIZONTAL));
$myPicture->Stroke();
JpGraghとくらべても見栄えが良く、カスタマイズ性にも富んでいます
ただこのpChart2、更新がだいぶ前からされていないようなので、
その辺を注意して使わないといけないようです
Tags: pChat